Understanding Web Analytics Metrics That Matter
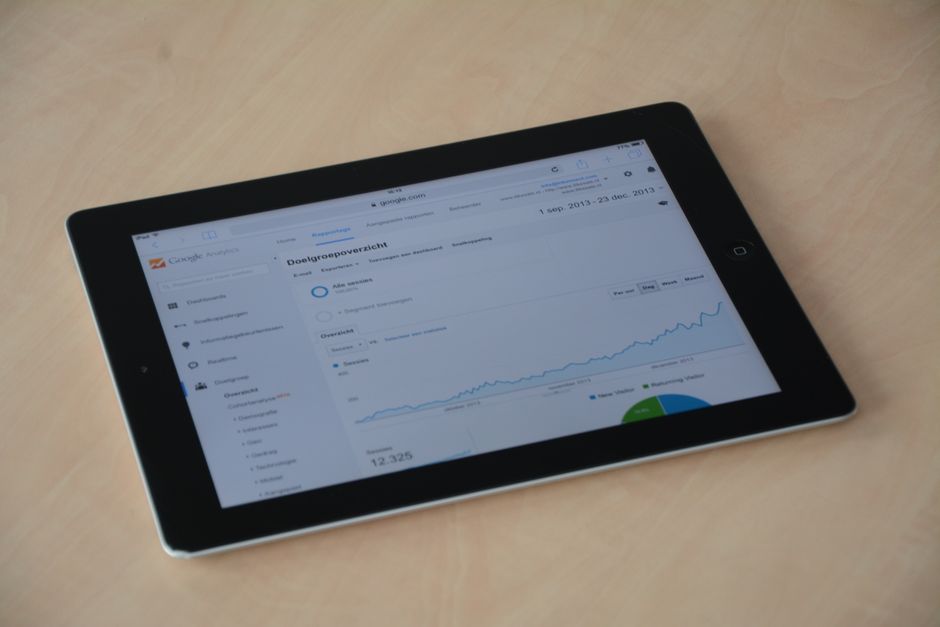
Web analytics provides a framework for understanding how visitors interact with a website. It involves the collection, measurement, and analysis of data about user behavior, often with the goal of improving digital properties. By examining a range of metrics, organizations can gain insights into traffic patterns, content effectiveness, and the overall user experience. This article outlines several key metrics—including bounce rate, session duration, and conversion rate—and discusses how to interpret them in context.
Interpreting web analytics metrics requires more than just reading numbers. Each metric represents a different aspect of user engagement and can be influenced by numerous factors such as website design, content quality, and external traffic sources. A single metric rarely tells the whole story; instead, a combination of metrics, viewed over time, provides a more complete picture. This article aims to explain the meaning and potential significance of these metrics, while emphasizing that their interpretation is highly dependent on the specific goals and context of a website.
Whether you are new to analytics or seeking to refine your understanding, this overview will help you navigate the complexities of web data. It is important to remember that metrics are tools for inquiry, not definitive answers. They can guide questions and highlight areas for further investigation, but they do not replace strategic thinking or professional judgment. The following sections explore each metric in detail, offering guidance on how to approach their analysis.
Bounce Rate: Understanding Single-Page Sessions
Bounce rate is defined as the percentage of sessions that begin and end on a single page, without any interaction that triggers a request to the analytics server. In other words, a bounce occurs when a visitor enters a site and leaves from the same page without clicking through to other pages or engaging with interactive elements. This metric is often used as an indicator of content relevance or user experience, but its meaning can vary widely depending on the type of website.
For example, a high bounce rate on a blog post might suggest that visitors found the information they needed quickly and left satisfied. Conversely, on an e-commerce product page, a high bounce rate could indicate that visitors are not finding what they expect, leading them to leave. Therefore, interpreting bounce rate requires context. It is also important to note that bounce rate is not inherently good or bad; it is simply a measure of behavior that can prompt further analysis.
Several factors can influence bounce rate, including page load time, visual appeal, clarity of messaging, and the presence of distracting elements. Additionally, traffic source plays a role: visitors from search engines may have different expectations than those from social media or direct traffic. When analyzing bounce rate, consider segmenting the data by source, device, and landing page to identify patterns. This can help distinguish between pages that are effectively serving their purpose and those that may need improvement.
Session Duration: Measuring Time Spent
Session duration, sometimes called average session duration, is the average amount of time visitors spend on a website during a single session. A session is a group of interactions that take place within a given time frame. This metric can provide insights into how engaging or useful visitors find the content. However, like bounce rate, it should be interpreted with caution. A long session duration might indicate deep engagement, but it could also result from confusion or difficulty finding information.
Similarly, a short session duration does not necessarily mean that content is poor; it might simply mean that visitors are efficient in accomplishing their tasks. For instance, a user checking a store’s hours or a weather forecast may spend only a few seconds on the site but still have a successful experience. Therefore, session duration is best analyzed alongside other metrics, such as pages per session or conversion rate, to gain a more nuanced understanding.
To analyze session duration effectively, consider the type of website and the goals of its visitors. On a news site, longer sessions might correlate with reading multiple articles, while on a support site, shorter sessions could indicate quick resolution of issues. Segmenting by user type, referral source, and device can reveal useful patterns. Additionally, it is important to recognize that session duration is an average; it can be skewed by outliers, so looking at the distribution of session lengths may provide additional insights.
Conversion Rate: Tracking Goal Completions
Conversion rate is the percentage of sessions that result in a desired action, such as making a purchase, filling out a form, or signing up for a newsletter. This metric is often considered a key performance indicator because it directly relates to the achievement of business objectives. However, conversion rate can vary greatly depending on the industry, the type of conversion, and the traffic source. A high conversion rate is generally desirable, but it must be evaluated in context.
For example, a 2% conversion rate might be excellent for an e-commerce site selling high-end products, while a 10% conversion rate could be expected for a lead generation page offering a free whitepaper. It is also important to define what constitutes a conversion and to ensure that tracking is set up correctly. Without accurate tracking, conversion rate data can be misleading. Furthermore, conversion rate should be analyzed alongside other metrics to understand the full user journey. A high conversion rate with a high bounce rate might suggest that the conversion action is happening on the landing page itself, which could be fine for some campaigns.
Improving conversion rate typically involves optimizing various elements of the website, such as the call-to-action, page layout, and form fields. However, changes should be made based on testing and data, not assumptions. It is also worth noting that conversion rate optimization is an ongoing process, as user behavior and market conditions can change over time. Regularly reviewing conversion rate in conjunction with other metrics can help identify opportunities for enhancement.
Interpreting Metrics in Context
Interpreting web analytics metrics requires a holistic approach that considers the relationships between different metrics and the broader context of the website’s purpose. No single metric should be viewed in isolation. For instance, a high bounce rate might be offset by a high conversion rate if the landing page is designed to encourage a specific action. Conversely, a low bounce rate and long session duration might not be beneficial if they do not lead to conversions. Therefore, it is essential to define clear objectives and select metrics that align with those objectives.
Additionally, it is important to establish benchmarks for comparison. These benchmarks can be internal (historical data) or external (industry averages). However, industry averages can vary widely, so they should be used as a rough guide rather than a strict target. It is also helpful to segment data by audience, channel, and device to uncover insights that might be hidden in aggregate numbers. For example, mobile users might have different behavior patterns than desktop users, and traffic from different sources might convert at different rates.
Finally, remember that web analytics is a tool for learning and improvement. It provides data that can inform decisions, but it does not make decisions. Human judgment, strategic thinking, and an understanding of the business are essential for translating data into action. By approaching metrics with curiosity and a willingness to explore, organizations can derive meaningful insights that support their goals. TechPulse encourages a balanced and informed approach to analytics, recognizing that every website is unique and that context is key.
Metrics are not prescriptive; they are descriptive. They describe what happened, not necessarily why it happened or what to do about it.
In conclusion, understanding web analytics metrics such as bounce rate, session duration, and conversion rate is a foundational step toward data-informed decision-making. Each metric offers a different lens on user behavior, and their interpretation depends on the specific context of the website. By considering multiple metrics together and avoiding simplistic conclusions, organizations can gain a more accurate picture of their digital performance. As you explore your analytics, focus on asking the right questions and using data to guide your inquiry, rather than seeking definitive answers.